Introducing the SOS-Water Wheel: making complex water assessments easier to understand
Assessing the sustainability of a river basin means looking beyond any single indicator. Different water functions, pressures and risks need to be considered together—and the relationships between them can be difficult to communicate.
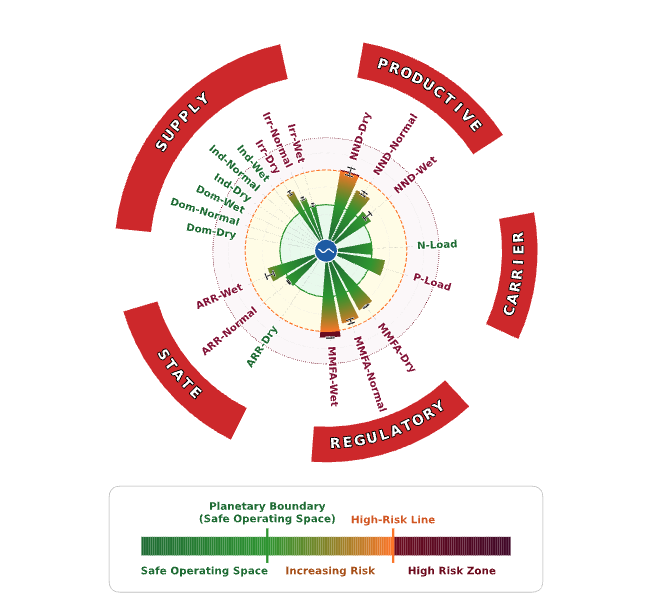
Developed as one of the SOS-Water project’s Key Exploitable Results, the SOS-Water Wheel addresses this challenge by translating a complex, multidimensional assessment into a compact and recognisable visual representation. An accompanying demonstration application explains the approach and enables users to create their own wheels using their own data.
From planetary boundaries to river basins
The Wheel takes inspiration from the widely recognised visual representations of planetary boundaries, which illustrate the environmental limits within which humanity can operate safely. SOS-Water adapts this approach to water management at basin scale. Instead of representing individual planetary boundaries, the Wheel organises information around water functions, each assessed through one or more indicators. These indicators are evaluated against defined risk thresholds.
Within the SOS-Water framework, a water function is considered fulfilled when all its indicators remain within their respective thresholds. When every function is fulfilled, the basin is assessed as being within a Safe Operating Space - supporting the stability of the wider water cycle. By bringing these assessments together, the Wheel helps users see where functions are fulfilled and where thresholds are exceeded, providing a starting point for discussing pressures, risks and possible responses.
A shared picture for research, policy and public dialogue
The Wheel’s core valueis its ability to make complex evidence easier to explore and discuss acrossdifferent audiences.
For water authorities, basin organisations and policymakers, Wheel visualisations can support stakeholder dialogue, planning and risk assessment. Comparing wheels for different scenarios or pathways can help make the implications of water-management choices more visible and support more transparent discussions.
For scientists and research organisations, the Wheel offers a way to display indicator values and their associated uncertainty, compare assessments and communicate findings beyond specialist audiences. Downloadable figures also support reuse in scientific publications, presentations and other dissemination materials.
For educators, communicators and the public, it provides an accessible entry point into questions about water-system pressures, risks and adaptation. Exploring different wheels can help people understand why sustainable water management requires consideration of several functions together.
Explore the application—and create your own Wheel
The SOS-Water Wheel application introduces the origins, meaning and use of the visualisation and allows users to draw a Wheel with their own data.
This makes it are usable resource for activities ranging from a basin-planning discussion or research comparison to a training session or public engagement event. Its value lies in giving people a shared visual reference through which to examine evidence and discuss what it means for a particular basin.
A resource beyond the project
The SOS-Water Wheel follows a non-commercial exploitation pathway, with its impact centred on uptake and reuse in policy, research, education and communication.
As a Key Exploitable Result, it is intended to carry the project’s assessment framework into future applications. Reuse by institutions, research infrastructures and successor projects offers a pathway for extending its value beyond SOS-Water and bringing the concept of a Safe Operating Space into further water-management discussions.
Explore the SOS-Water Wheel and create your own visualisation.